The Racist Housing Policy That Made Your Neighborhood
The freewheeling opportunity associated with 20th-century California was not available to black residents, and that exclusion reverberates in our neighborhoods and communities today.
Before you read this post, read Ta-Nehisi Coates’s powerful case for reparations, our cover story this month. In it, TNC (as he is known around here) relentlessly demonstrates the “compounding moral debts” of discriminatory practices, especially around housing.
One of the most heinous of these policies was introduced by the creation of the Federal Housing Administration in 1934, and lasted until 1968. Otherwise celebrated for making homeownership accessible to white people by guaranteeing their loans, the FHA explicitly refused to back loans to black people or even other people who lived near black people. As TNC puts it, “Redlining destroyed the possibility of investment wherever black people lived.”
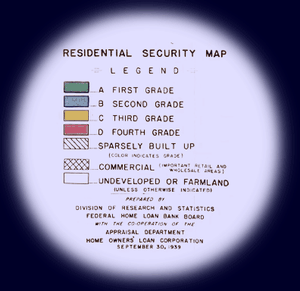
To understand the depth of the racism of these regulations, you have to read the descriptions of the grades that FHA gave to neighborhoods from A (green) to D (red). I’ve included them all at the end of this post, but here is the “C” classification (emphasis added), which is where my Oakland neighborhood fell (keep in mind restrictions as used here, means clauses, written into the title, not to sell to nonwhites).
Yellow areas are characterized by age, obsolescence, and change of style; expiring restrictions or lack of them; infiltration of a lower grade population; the presence of influences which increase sales resistance such as inadequate transportation, insufficient utilities, perhaps heavy tax burdens, poor maintenance of homes, etc. “Jerry” built areas are included, as well as neighborhoods lacking homogeneity. Generally, these areas have reached the transition period. Good mortgage lenders are more conservative in the Yellow areas and hold loan commitments under the lending ratio for the Green and Blue areas.
And, of course, the mortgage industry as a whole—the expansion of which allowed people without large savings or family money to buy homes—adopted many of these same practices. This had all sorts of truly horrific consequences for black people, black families, and black neighborhoods.
TNC focuses in on North Lawndale, a neighborhood in Chicago, to make his point. But it’s a similar story across the country.
North Lawndale is an extreme portrait of the trends that ail black Chicago. Such is the magnitude of these ailments that it can be said that blacks and whites do not inhabit the same city. The average per capita income of Chicago’s white neighborhoods is almost three times that of its black neighborhoods. When the Harvard sociologist Robert J. Sampson examined incarceration rates in Chicago in his 2012 book, Great American City, he found that a black neighborhood with one of the highest incarceration rates (West Garfield Park) had a rate more than 40 times as high as the white neighborhood with the highest rate (Clearing). “This is a staggering differential, even for community-level comparisons,” Sampson writes. “A difference of kind, not degree.” …
Black people with upper-middle-class incomes do not generally live in upper-middle-class neighborhoods. Sharkey’s research shows that black families making $100,000 typically live in the kinds of neighborhoods inhabited by white families making $30,000. “Blacks and whites inhabit such different neighborhoods,” Sharkey writes, “that it is not possible to compare the economic outcomes of black and white children.”
Even here in California, where sometimes we like to imagine maybe things were different.
A few years ago, I came across an academic project to take the old redlining maps and lay them over the cities as they are today in Google Maps. It was run by an interdisciplinary group out of the University of North Carolina. They created a site called T-RACES, or Testbed for for the Redlining Archives of California’s Exclusionary Spaces.
I stared and stared at the map of the East Bay because I could see the marks of this discrimination all over the city. My little neighborhood sits right next to a block of red, in a yellow strip, and near a swath of blue. It was an in-between zone, and it still feels that way. Go a few blocks west (downhill) and the neighborhoods are primarily black. Go a few blocks east (into the hills) and the neighborhoods are almost exclusively white.
T-RACES was meant to be a demonstration project, and it looks that way. The maps are difficult to navigate and just have a clunky feel. When I tweeted about them, a data artist named Josh Begley took it upon himself to recode the maps with new technology. And then—after Google broke the way he was doing it—he recoded the maps again for this post.
There are maps for the Bay, Los Angeles, San Diego, San Jose, Sacramento, Fresno and Stockton. I’ve included Los Angeles here, too, but the rest are available at his site.
The point is: The racist policies TNC explores in Chicago were everywhere.
Here are the codes for the maps:
Green areas are “hot spots”; they are not yet fully built up. In nearly all instances they are the new well planned sections of the city, and almost synonymous with the areas where good mortgage lenders with available funds are willing to make their maximum loans to be amortized over a 10-15-year period—perhaps up to 75-80% of the appraisal. They are homogeneous; in demand as residential locations in “good time” or “bad”; hence on the upgrade.
Blue areas, as a rule, are completely developed. They are like a 1935 automobile still good, but not what the people are buying today who can afford a new one. They are the neighborhoods where good mortgage lenders will have a tendency to hold loan commitments 10-15% under the limit.
Yellow areas are characterized by age, obsolescence, and change of style; expiring restrictions or lack of them; infiltration of a lower grade population; the presence of influences which increase sales resistance such as inadequate transportation, insufficient utilities, perhaps heavy tax burdens, poor maintenance of homes, etc. “Jerry” built areas are included, as well as neighborhoods lacking homogeneity. Generally, these areas have reached the transition period. Good mortgage lenders are more conservative in the Yellow areas and hold loan commitments under the lending ratio for the Green and Blue areas.
Red areas represent those neighborhoods in which the things that are now taking place in the Yellow neighborhoods, have already happened. They are characterized by detrimental influences in a pronounced degree, undesirable population or infiltration of it. Low percentage of home ownership, very poor maintenance and often vandalism prevail. Unstable incomes of the people and difficult collections are usually prevalent. The areas are broader than the so-called slum districts. Some mortgage lenders may refuse to make loans in these neighborhoods and other will lend only on a conservative basis.